
Graph of a Function
The set of all points in the analytic coordinate plane corresponding to the ordered pairs of a function is called the graph of that function.
\[f: A \to B, \quad f= \{ (x,y) \mid x \in A , \; y \in B \quad \text{and} \quad y= f(x) \} \]
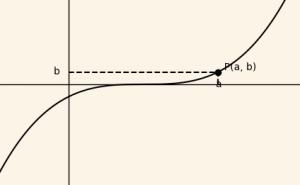
Since \( (a, b) \in f \), we have \( b = f(a) \).
Question 16
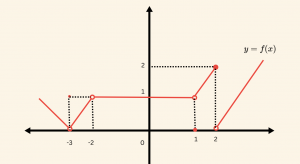
The graph of the function \( y= f(x) \) is given below:
\[ \text{Evaluate the expression: } A= \frac{f(-3)+ f(1) }{f(2)} \]
\[ \text{A)} 2 \quad \text{B) } 1 \quad \text{C) } \frac{1}{2} \quad \text{D) } -\frac{1}{2} \quad \text{E )} -1 \]
Solution:
By analyzing the coordinate points directly from the given graph, we can determine the output values for each input:
\[
\begin{aligned}
&f(-3)= 1 \quad \text{(The curve passes through } (-3, 1)\text{)} \\
\\
&f(1)=0 \quad \text{(The x-intercept point is located at } (1, 0)\text{)} \\
\\
&f(2) = 2 \quad \text{(The curve passes through } (2, 2)\text{)}
\end{aligned}
\]
\[ A= \frac{1+0}{2} = \frac{1}{2} \]
\(\textbf{Correct Answer: C} \)
Question 17
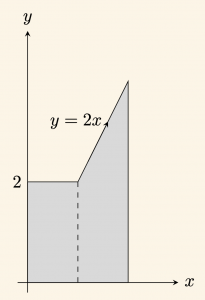
Based on the geometric figure above, an area function is defined as \( f:x \to \text{“the shaded area to the left of the vertical line at } x\text{“} \). Find the algebraic equation representing \( f(x) \) for any input value where \( x > 1 \).
\[ \text{A)} x^2 \quad \text{B) } x^2+1 \quad \text{C) } x^2+2 \quad \text{D) } x^2+3 \quad \text{E )} x^2+4 \]
Solution:
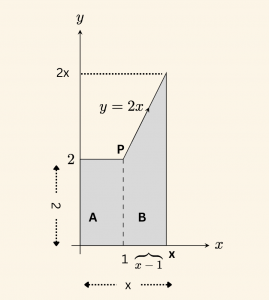
In the figure, since the point \( P \) with the ordinate \( 2 \) lies on the line \( y = 2x \), we have:
\[ 2 = 2x \Rightarrow x = 1 \]
which means the abscissa of this point is \( 1 \).
\[ f(x) = \text{Area (A)} + \text{Area (B) } \quad \text{( Area B is trapezoid ) } \]
\[ \text{Area (B) } = \frac{(2+2x)\cdot (x-1) }{2}= x^2 \ – \ 1 \]
\[ = 2 + x^2 – 1 = x^2 + 1 \]
\(\textbf{Correct Answer: B} \)