
Graph of a Relation
The set of points in the analytic plane that correspond to the elements of a relation is called the graph of that relation.
To sketch the graph of a relation, the same procedure used for sketching the graph of a Cartesian product is followed. This is because a relation is, by definition, a subset of the Cartesian product.
Example:
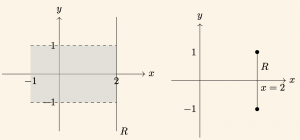
Let us sketch the graph of the relation \[ R = \{(x,y) \in \mathbb{R}^2 \;|\; x = 2 \quad \text{and } \quad |y| \le 1 \} \]
\[x= 2 \quad \text{and } \quad |y| \le 1 \Rightarrow -1 \le y \le 1 \]
Example:
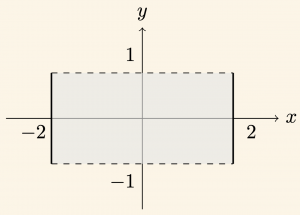
As a relation defined on \( \mathbb{R} \times \mathbb{R} \): \[ R = \{(x,y)\in \mathbb{R} \times \mathbb{R} \quad (\text{or}\; \mathbb{R}^2) : |x| \le 2 \quad \text{and} \quad -1 < y < 1\}\]
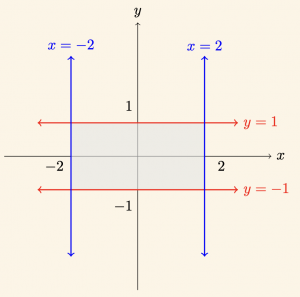
The graph of the relation on \( \mathbb{R}^2 \) and its intersections are shown in the figures. (The intersection is shown in the graph below)
Example:
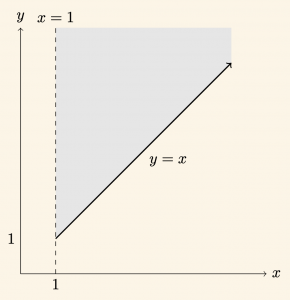
Let us sketch the graph of the relation \[ R = \{ (x, y) \in \mathbb{R}^2 \;|\; y \ge x \quad \text{and } \quad x > 1 \} \] defined on the set \( \mathbb{R}^2 \) (Real Numbers).
\[
R = \bigl\{(x,y)\in \mathbb{R}^2 \;|\; x>1 \quad \text{and} \quad y \ge x \bigr\}.
\]
Example:
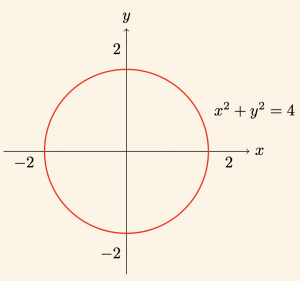
Let us sketch the graph of the relation \[ R = \{ (x, y) \in \mathbb{R}^2 \;|\; x^2+ y^2 = 4 \} \] defined on the set \( \mathbb{R}^2 \) (Real Numbers).
The set of ordered pairs satisfying the equation \(x^2+ y^2 = 4 \) represents a circle centered at the origin with a radius of 2 units.
Warning:
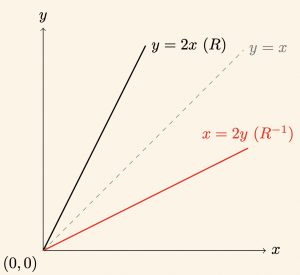
The graph of a relation \(R \) and the graph of its inverse relation \(R^{-1} \) are symmetric with respect to the line \(y= x \).
Example:
Let us sketch the graphs of the relation \[ R = \{ (x,y) \in \mathbb{R}^2 \;|\; y = 2x \} \] and its inverse relation \[ R^{-1} = \{ (x,y) \in \mathbb{R}^2 \;|\; x = 2y \} \] defined on \( \mathbb{R}^+ \cup \{0\} \).
← Previous Page | Next Page →