Graphing Inequalities
The set of points in the coordinate plane that satisfy an inequality is called the graph of that inequality.
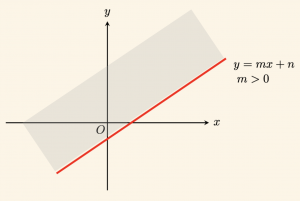
1) The shaded region shown represents the graph of the inequality \[ y \geq mx + n \quad m > 0 \]
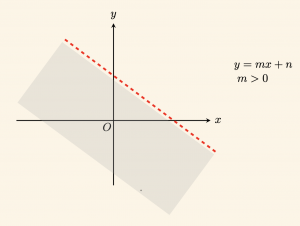
2) The shaded region shown represents the graph of the inequality \( y < mx + n \). Since strict inequality is used, points lying on the boundary line \( y = mx + n \) do not satisfy the inequality.
Consequently, the boundary line \( y = mx + n \) is drawn as a dashed line.
Graphing Quadratic Inequalities:
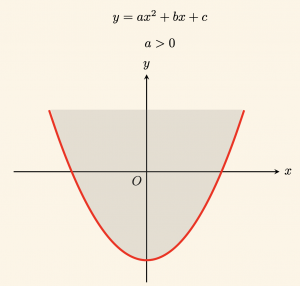
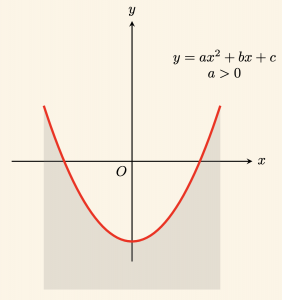
1) The shaded region shown represents the graph of the inequality \( y \geq ax^2 + bx + c \) for (\(a > 0\)).
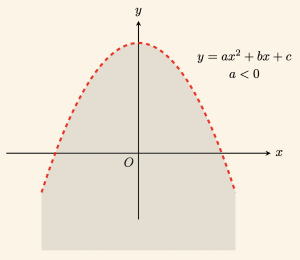
2) The shaded region shown represents the graph of the inequality \( y > ax^2 + bx + c \). Since strict inequality is used, points on the parabola \( y = ax^2 + bx + c \) do not satisfy the inequality.
For this reason, the boundary parabola is drawn as a dashed curve.
3) The shaded region shown represents the graph of the inequality \( y \leq ax^2 + bx + c \) for (\(a > 0\)).
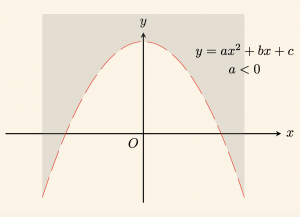
4) The shaded region shown represents the graph of the inequality \( y < ax^2 + bx + c \) for (\(a < 0\)). Since strict inequality is used, the boundary curve is dashed.
Note:
The curve or line defined by \(y = f(x)\) divides the coordinate plane into two distinct regions. One region represents the inequality \(y > f(x)\), and the other represents \(y < f(x)\).
To determine which region corresponds to the desired inequality, select any test point from one of the regions and substitute its coordinates into the expression \(y = f(x)\).
Example:
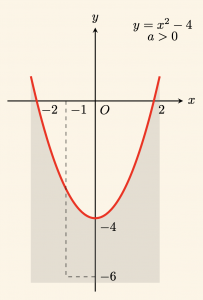
Find the inequality whose graph is shown in the figure.
Let’s pick a test point \(A(-1, -6)\) inside the shaded region and substitute its coordinates into the boundary equation \(y = x^2 – 4\):
\[
\text{For } x = -1 \quad \text{ and } \quad y = -6: \quad -6 < (-1)^2 – 4 \Rightarrow -6 < -3
\]
Since this statement is true and the boundary is solid, the inequality is found to be \( y \leq x^2 – 4 \).
Example:
Graph the inequality \( y – x^2 + 4x \leq 0 \).
First, let’s sketch the boundary equation:
\[
y – x^2 + 4x = 0 \Rightarrow y = x^2 – 4x
\]
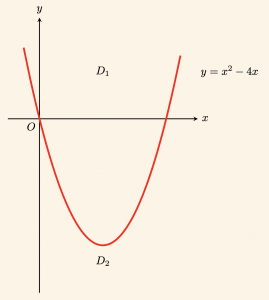
The parabola divides the coordinate plane into two regions, labeled \(D_1\) and \(D_2\). Let’s pick a test point \(A(0, -5)\) within region \(D_2\) to see if it satisfies the inequality:
\[
\text{For } x = 0,\quad y = -5: \quad y \; – \; x^2 + 4x \leq 0 \]
\[\Rightarrow -5 – \;0^2 + 4 \cdot 0 \leq 0 \Rightarrow -5 \leq 0
\]
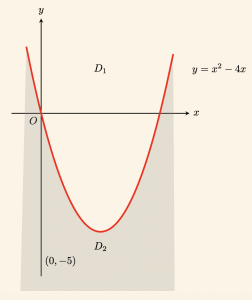
Since the statement is true, region \(D_2\) containing the test point \(A(0, -5)\) is the correct solution set.
Example:
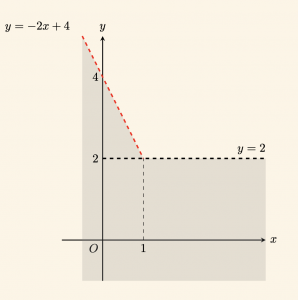
Graph the inequality \( y < |x – 1| – x + 3 \).
For \(x \geq 1\):
Since \[|x – 1| = x – 1\], we get:
\[
y < x – 1 – x + 3 \Rightarrow y < 2
\]
For \( x < 1 \):
Since \[|x – 1| = -(x – 1) = -x + 1\], we get:
\[
y < -x + 1 – x + 3 \Rightarrow y < -2x + 4
\]
Example:
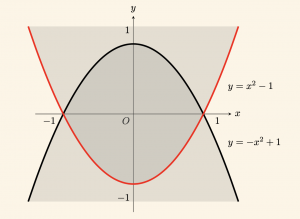
Graph the inequality \( |y| \geq x^2 – 1 \).
For \(y \geq 0\): Since \(|y| = y\), we obtain:
\[
y \geq x^2 – 1
\]
For \(y < 0\): Since \(|y| = -y\), we obtain:
\[
-y \geq x^2 – 1 \Rightarrow y \leq -x^2 + 1
\]
Example:
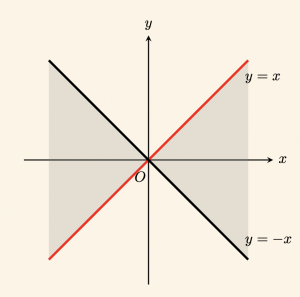
Graph the inequality \( |y| \leq |x| \).
For \(x \geq 0 \) and \(y \geq 0 \): \( |y| \leq |x| \Rightarrow y \leq x \)
For \(x \leq 0 \) and \(y \geq 0 \): \( |y| \leq |x| \Rightarrow y \leq -x \)
For \(x \leq 0 \) and \(y \leq 0 \): \( |y| \leq |x| \Rightarrow -y \leq -x \Rightarrow y \geq x \)
For \(x \geq 0 \) and \(y \leq 0 \): \( |y| \leq |x| \Rightarrow -y \leq x \Rightarrow y \geq -x\)
← Previous Page | Next Page →