Irrational Numbers
Numbers that correspond to a distinct point on the number line but are not rational are called irrational numbers. These numbers cannot be expressed as the quotient of two integers (i.e., written as a simple fraction). Here are a few notable examples of irrational numbers:
- √2 (the square root of 2): Approximately equal to 1.414, this value cannot be written as a ratio of two integers and is strictly irrational.
- π (pi): Representing the constant ratio of a circle’s circumference to its diameter, its value is approximately 3.14159… and is irrational.
- e (Euler’s number): Serving as the foundational base for natural logarithms, e is approximately equal to 2.718 and is irrational.
- √3 (the square root of 3): Approximately equal to 1.732, this is another classic irrational value.
While these values occupy definite, precise locations on the number line, they cannot be expressed in fractional form. For this reason, they are explicitly classified as non-rational or irrational.
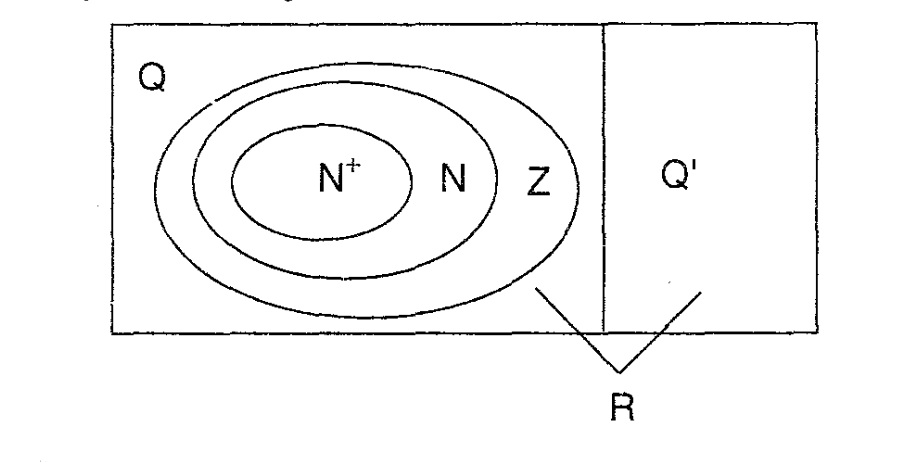
The set of all irrational numbers is denoted by Q’ (or sometimes \(\mathbb{I}\)). The union of the rational numbers and the irrational numbers forms the set of real numbers, which is represented by the symbol R. This fundamental algebraic relationship is defined as:
\[R= Q\quad\cup\quad Q’\]
Real numbers completely fill the continuous space of the number line; every unique point corresponds to a single real number. Consequently, a perfect one-to-one correspondence exists between the real number system and the geometric number line.
These number sets and their nested relationships can be structurally visualized using a Venn diagram. This diagram illustrates the hierarchy connecting the set of real numbers (R), rational numbers (Q), integers (Z), and natural numbers (N):
$$Z^+ = N^+\subset N \subset Z \subset Q \subset R \quad \text{and} \quad Q’ \subset R $$
Venn Diagram Visualization
The set of real numbers (R) forms the universal domain that completely encompasses both the rational numbers (Q) and the irrational numbers (Q’). The Venn diagram below provides a structural overview of these subsets: